
To view the Department for Education performance tables, click on the link below:
School’s Performance Tables Page
To view our school’s performance page, click on the link below:
Beaudesert Lower School Performance tables page
During the Summer Term, children in Year 2 are assessed against the criteria of the Statutory Assessment Tests (SATs). These tests mark the end of Key Stage 1 and are designed to show what your child has learned and retained in Reading, Writing, Maths and Science.
SATs tests cannot be passed or failed, but indicate the level a child is working within.
2018 – Year 2 Teachers Assessments Results – end of Key Stage One – Year 2
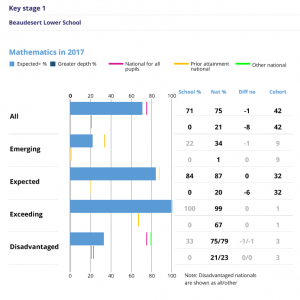
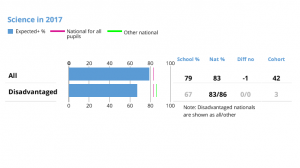
2017 – Year 2 Teachers Assessments Results – end of Key Stage One – Year 2
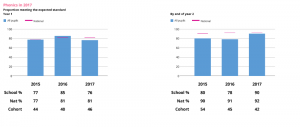
2017 – Phonics Test Results – Key Stage One – Year 2
2016 Year 2 Results – Reading
School Key Stage 1 Teacher Assessment Results 2016 compared with Local Authority results 2016
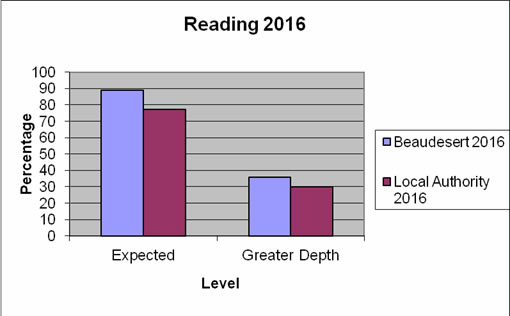
| Reading 2016 | EXS | GDS |
| Beaudesert 2016 | 89 | 36 |
| Local Authority | 77 | 30 |
Key:
EXS % of pupils working at the expected level
GDS % of pupils working at greater depth than expected
2016 Year 2 Results – Writing
School Key Stage 1 Teacher Assessment Results 2016 compared with Local Authority data 2016
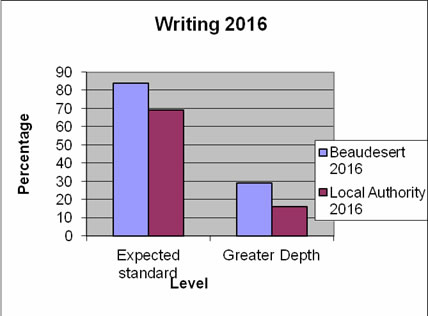
| Writing 2016 | EXS | GDS |
| Beaudesert 2016 | 84 | 29 |
| Local Authority 2016 | 69 | 16 |
Key:
EXS: % of pupils working at the expected level
GDS: % of pupils working at greater depth than expected
|
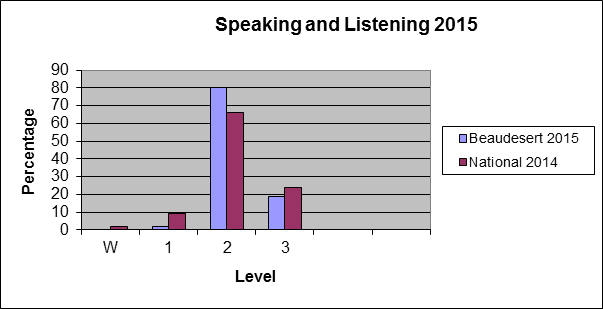
Speaking and Listening 2015 |
W |
1 |
2 |
3 |
|
Beaudesert 2015 |
0 |
2 |
80 |
19 |
|
National 2014 |
2 |
9 |
66 |
24 |
2016 Year 2 Results – Maths
School Key Stage 1 Teacher Assessment Results 2016 compared with Local Authority data 2016
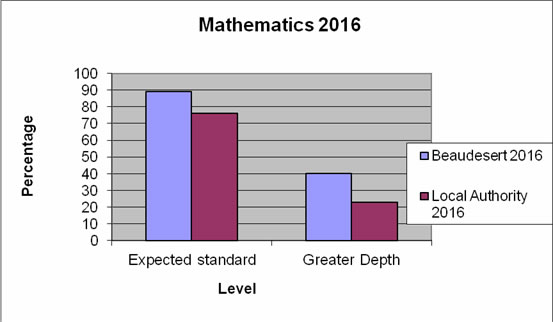
| Maths 2016 | EXS | GDS |
| Beaudesert 2016 | 89 | 40 |
| Local Authority | 76 | 23 |
Key:
EXS % of pupils working at the expected level
GDS % of pupils working at greater depth than expected
|
Science 2015 |
W |
1 |
2 |
3 |
|
Beaudesert 2015 |
0 |
2 |
69 |
30 |
|
National 2014 |
2 |
8 |
68 |
22 |
To view the Department for Education performance tables, click on the link below: